An annual report delivers information back to a brand's supporters at the end of the year, whether they are shareholders in a for-profit company or donors to a non-profit. Shareholders want to see the financial results from the past year, plus the strategic plans for the next year. For non-profits, its an important opportunity to thank their donors and show the social impact of those donations on their supported causes.
Here are seven best practices to keep in mind when you are planning for and designing your next annual report:
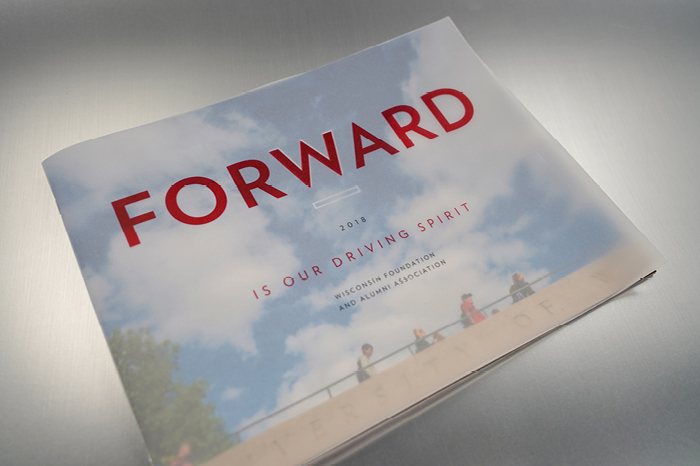
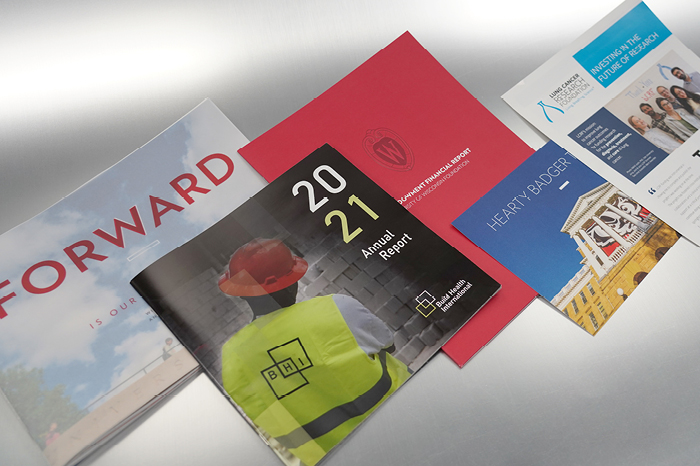
1. Get Creative With Your Cover
The first hurdle for any annual report is to get your recipients to open it with enthusiasm. A cover that inspires curiosity can help. Wisconsin Foundation and Alumni Association printed on a vellum outer wrap for their report that gave recipients a see-through peek to the colorful campus photo on the cover.

2. Find a Unique Way to Open
This insurance company used a gate fold on their cover in the shape of two armchairs to introduce their new branding campaign. The paper was also covered in a soft touch coating and the armchairs were embossed to provide a tactile sensory experience while it was being read.
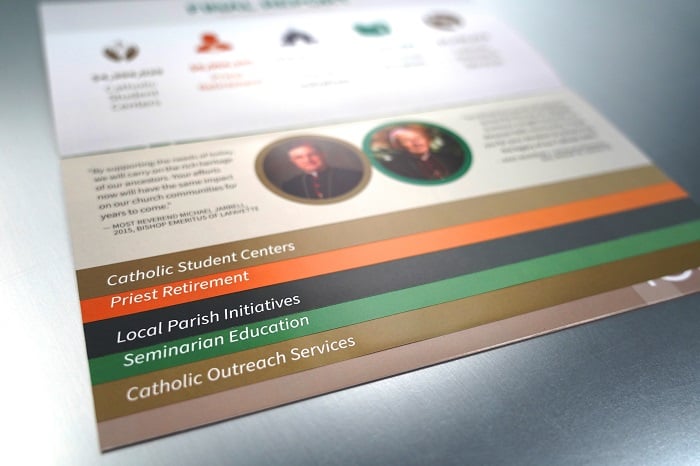
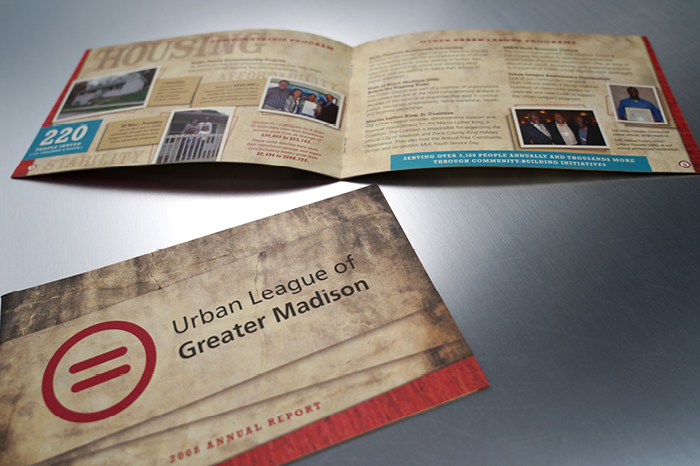
3. Organize Your Information
You can use stepped pages in a stitched booklet to organize your information into sections. Slightly altering where the pages are folded creates faux tabs so a reader can jump to the section they are most interested in.
We have this stepped booklet built as a template, ready for you to drop your art in. Download a copy of our That's-A-Wrap booklet template here.
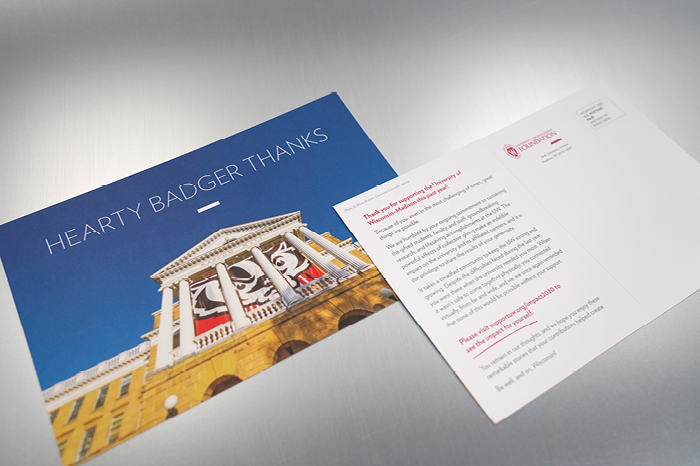
4. Go Small
Don't want to send out an entire booklet? You could mail a postcard with a link to download and read the full annual report in an online format. University of Wisconsin Foundation used this strategy in 2020 during COVID when paper was in short supply.
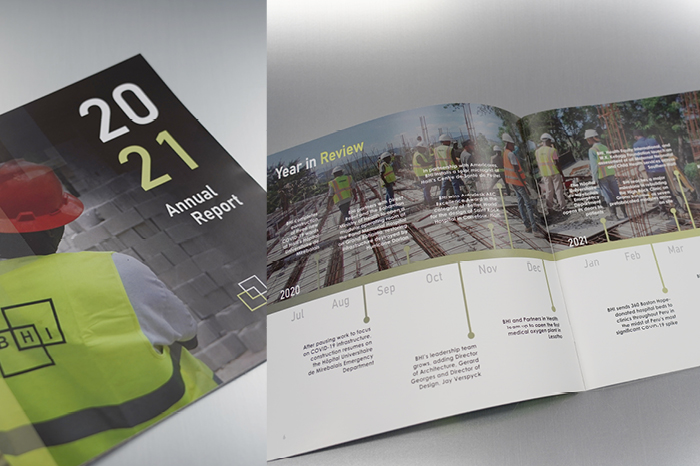
5. Make a Timeline
If you have date-based information to share, lay it out in a timeline format for easy reading. This will be a more visually interesting way to read than a bulleted list of dates and events.
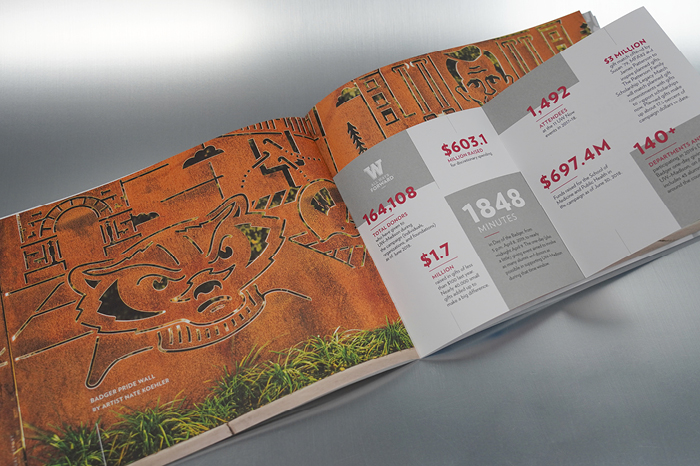
6. Show Statistics
Numbers can help make a big impression on your readers. Style them in an infographic format to make them stand out to increase reading comprehension. Some numbers are better off rounded, like millions of dollars raised/earned, while other exact numbers can be more interesting, like total donors or shareholders.
7. Tell Stories
While numbers and dates are great, nothing resonates better than stories of people who have been impacted by your work. Be sure your annual report includes some anecdotes so it is not dry reading. People love to work with and donate to other people, so always be sure to include the human element in your copy.
If you need help with the design, printing or mailing of your next annual report, reach out to us for a quote!